This directory contains the most commonly-requested data-files of estimated fields described in Lowry & Pérez-Gussinyé
(2011) The role of crustal quartz in controlling
Cordilleran deformation, Nature, 471(7338),
doi:10.1038/nature09912, 353-357.
Included here:
- MapHK.xyheke contains optimally interpolated
estimates of crustal thickness and vP/vS ratio, from joint inversion of seismic receiver functions, gravity and
surface heatflow measurements. (Ascii, six columns: Longitude, Latitude, Crustal Thickness (km), 1-sigma uncertainty (km),
vP/vS ratio, 1-sigma uncertainty. Images shown below:
|
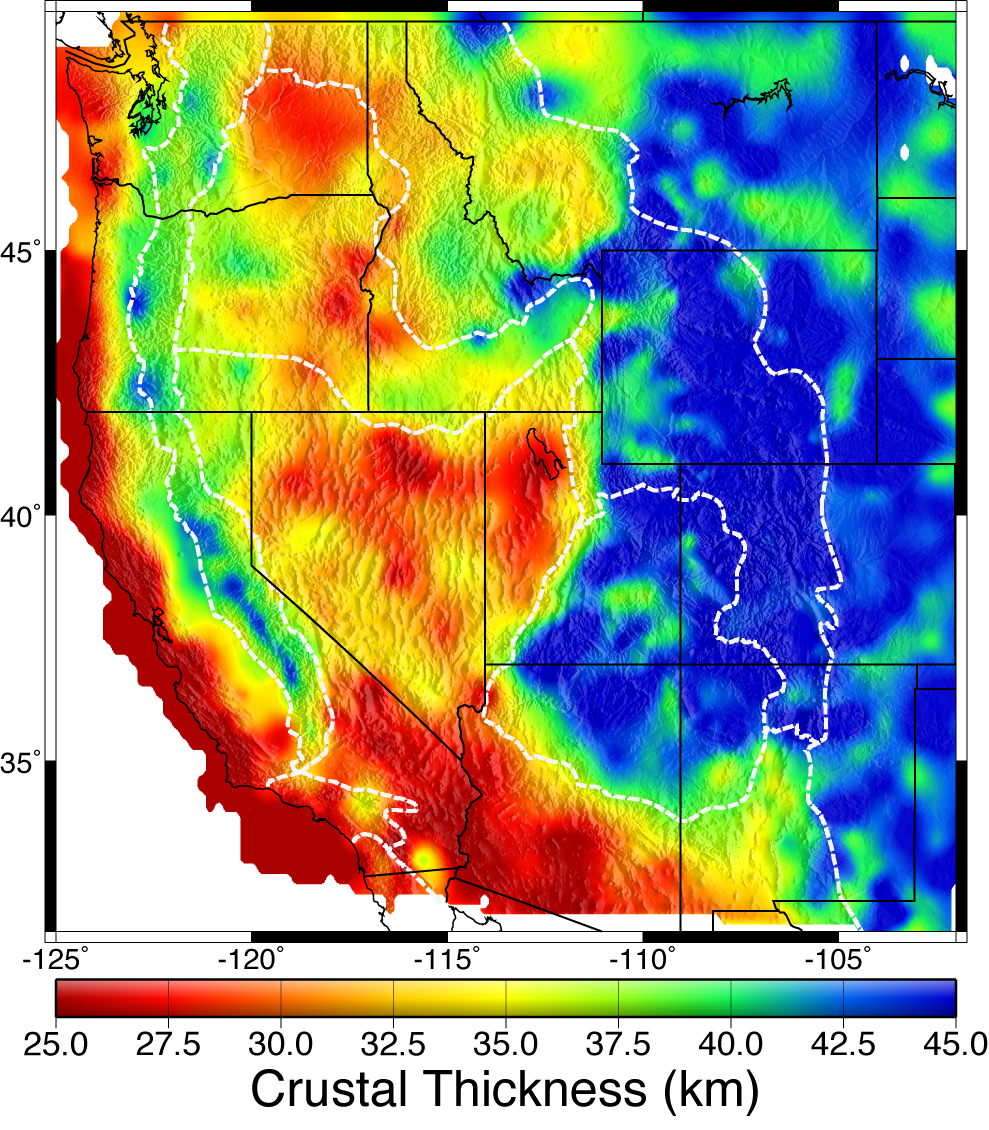
Crustal thickness (km) from Lowry & Pérez-Gussinyé.
|
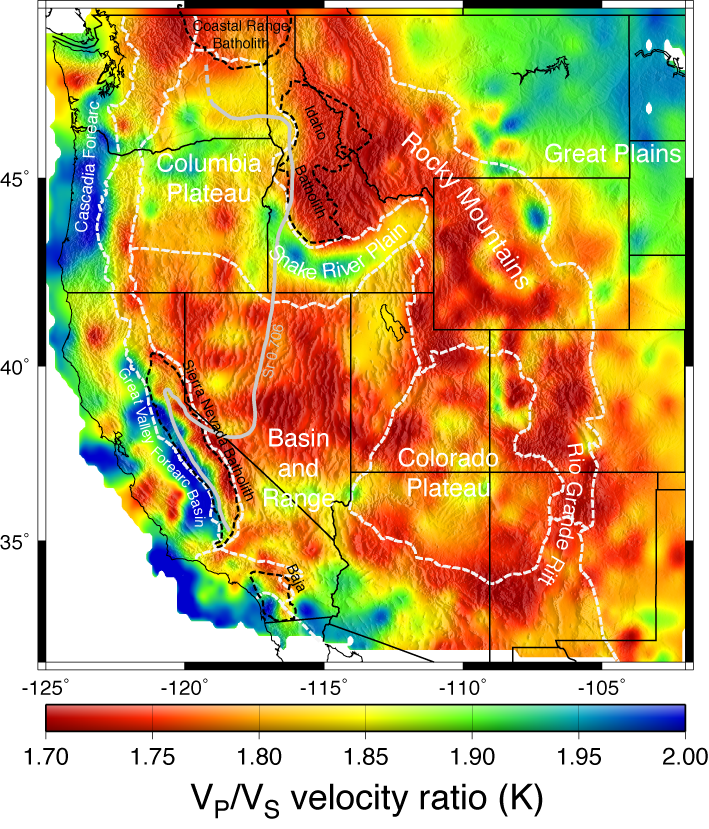
Bulk-crustal seismic velocity ratio (vP/vS) from Lowry & Pérez-Gussinyé.
|
- MapGrav.xyohktm contains gridded
estimates of Bouguer gravity fields modeled for crustal thickness, vP/vS ratio, geothermal
variations, and the observed and total modeled gravity. (Ascii, seven columns: Longitude, Latitude, observed Bouguer gravity (mGal),
Bouguer gravity modeled from crustal thickness (mGal), from vP/vS (mGal), from geothermal variations (mGal),
and the total model (summing the previous three; mGal). Images shown below:
|
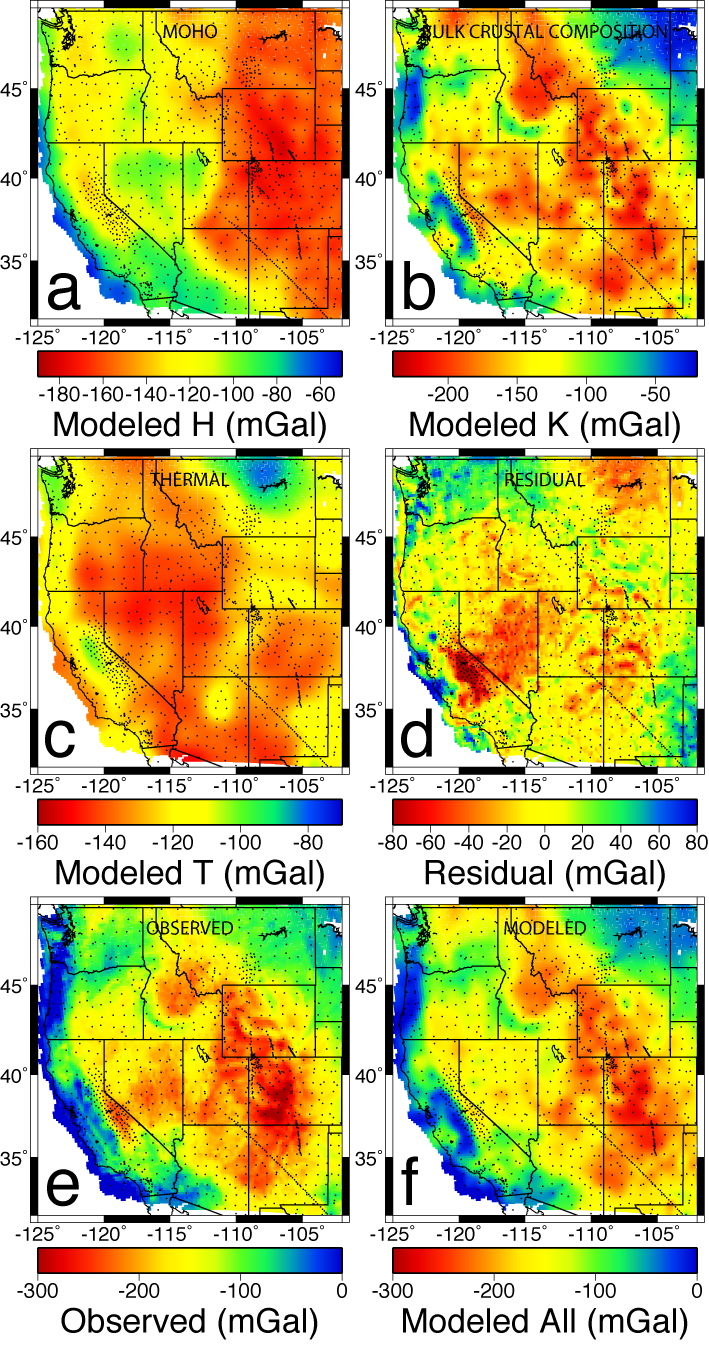
Bouguer gravity fields calculated for (a) Moho, (b) crustal composition, (c) geothermal variations,
(d) residual from observed gravity, (e) observed Bouguer gravity, (f) total modeled gravity. From Lowry & Pérez-Gussinyé.
|
|
- Qs_Map.llqs contains gridded
estimates of surface heat flow. (Ascii, four columns: Longitude, Latitude, measured surface heat flow (mW/m2), one-sigma
uncertainty (mW/m2)). Also, Te.llt
has effective elastic thickness estimates (Ascii, three columns: Longitude, Latitude, measured Te (km)).
Images shown below:
|
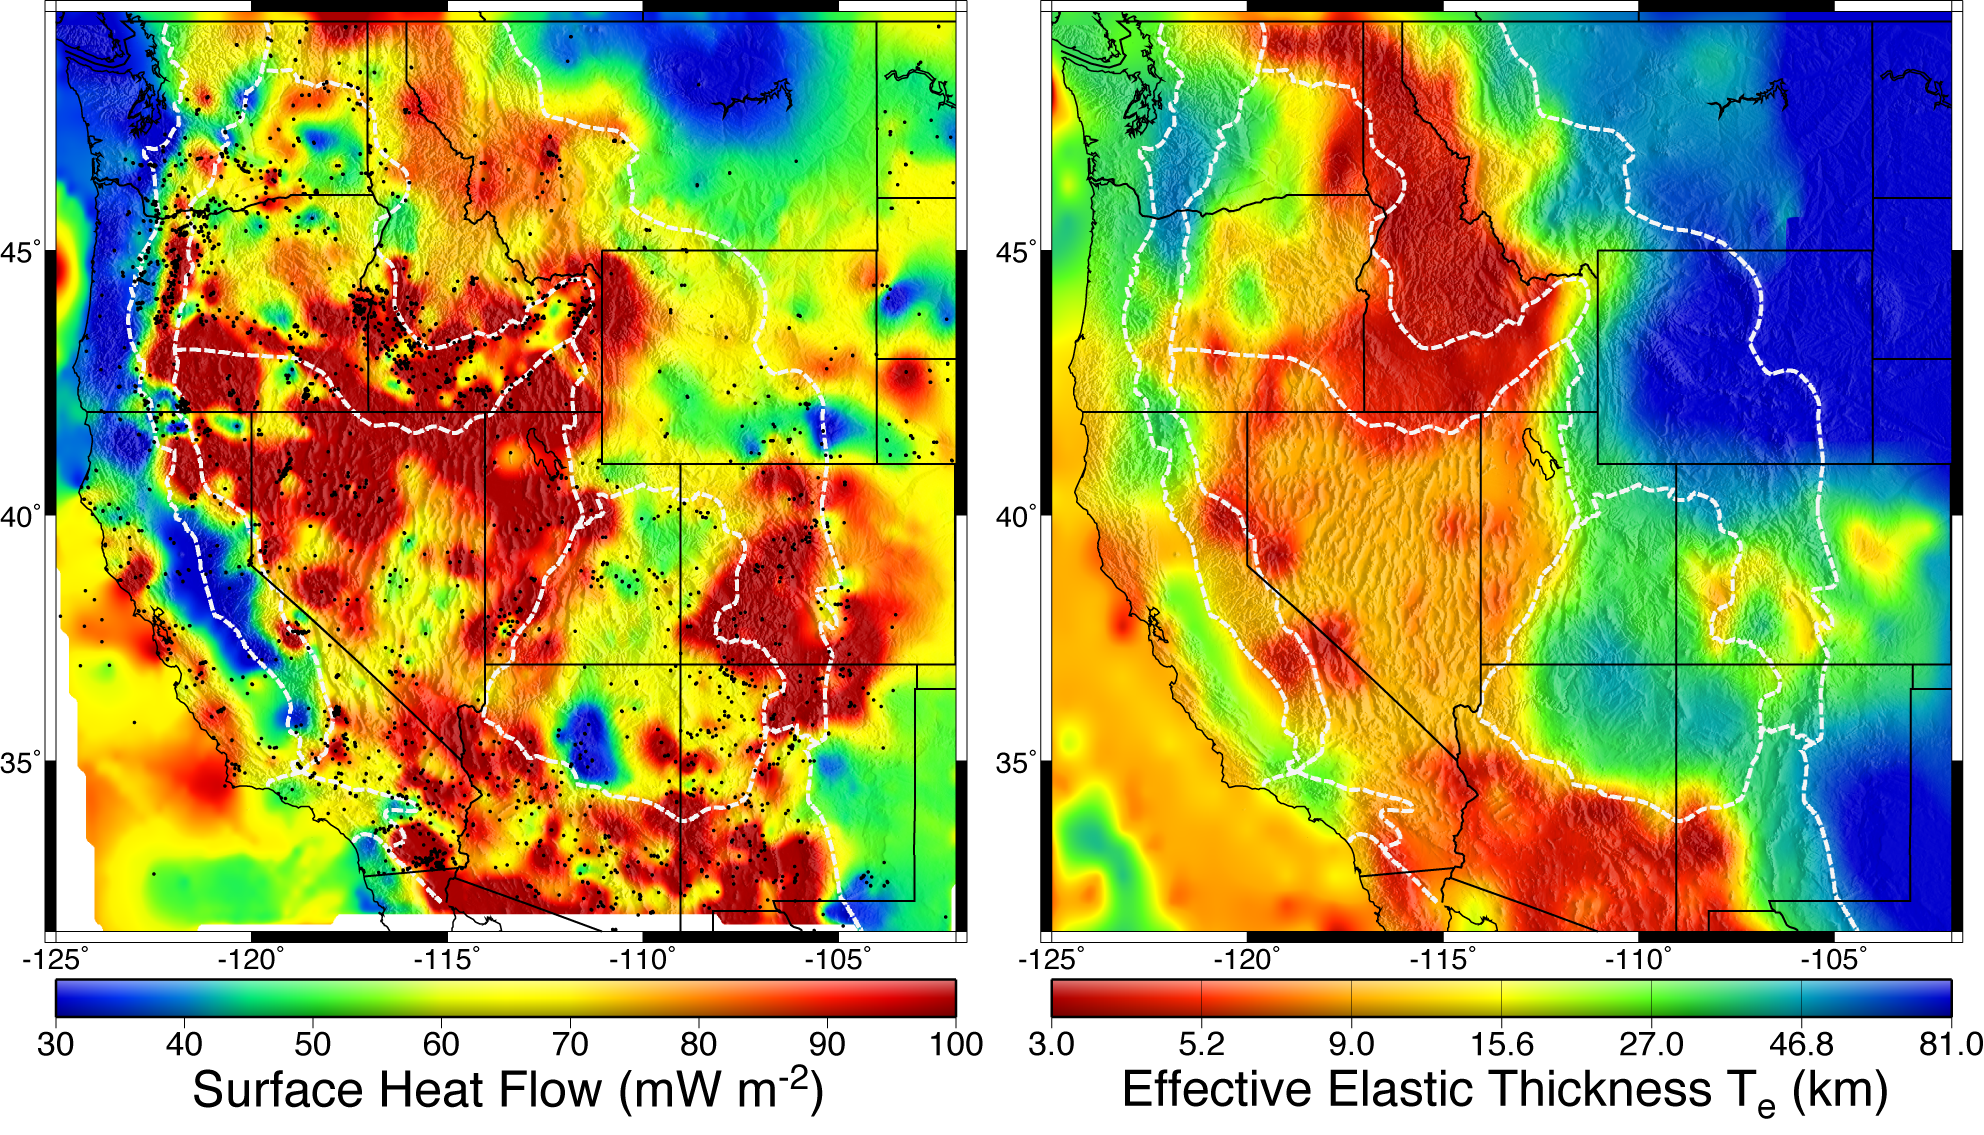
Left panel: Gridded surface heat flow (mW/m2). Right panel: Effective elastic thickness Te (km).
From Lowry & Pérez-Gussinyé.
|
|
If there are other fields described in Lowry & Pérez-Gussinyé (2011) that you would like to acquire,
let me know and I'll provide them/include them here.
|