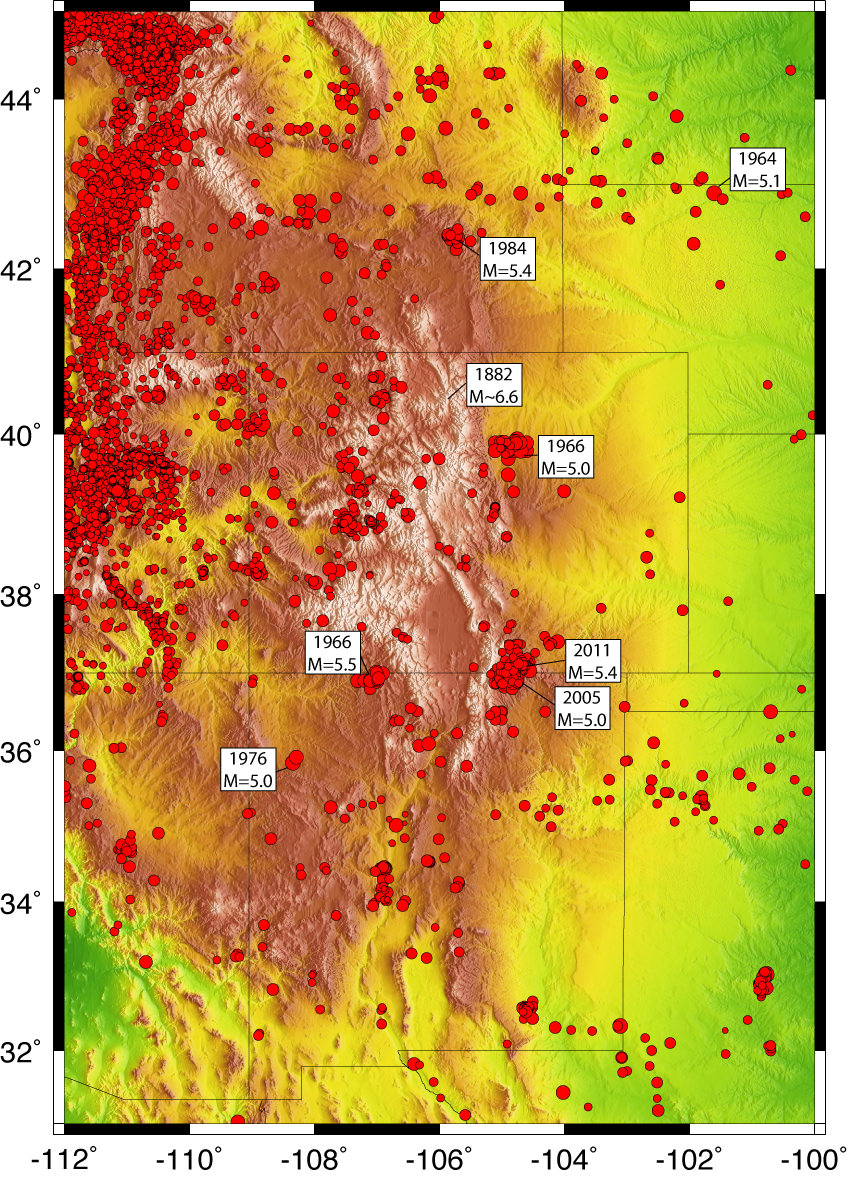
Earthquake Hazard Posed by the Rio Grande Rift

EARTHQUAKE HAZARD

Earthquake hazard is estimated from one or more of three types of information:

  • Past (Historical) Earthquakes
  • Past (Prehistorical) Earthquakes
  • Deformation of the Ground Surface

    All three of these different types of data are very incomplete in the region of the Rio Grande Rift, which is one of the motivations for undertaking this project!


  • PAST (HISTORICAL) EARTHQUAKES


    Earthquakes in the ANSS combined catalog, 1962 to June 2012.

    Historical earthquakes in the vicinity of the Rio Grande Rift (including west Texas, New Mexico, Colorado and southeastern Wyoming) hint at the potential for larger events in the future. An 1882 earthquake west of Fort Collins, CO had moment magnitude 6.6 (plus or minus 0.6), and there have been five earthquakes with magnitude greater than 5 in the past fifty years.

    To be useful for understanding earthquake hazard, seismicity should be observed from a dense seismic network over a long period of time (i.e., most of an earthquake cycle). In the Rio Grande Rift region, we have neither a good seismic network nor a long historical record. Written records in the region extend back only 150 to 300 years (and are longest in New Mexico), but the earthquake recurrence interval on major faults is at least 5000 years (see next section!). Also, the CO-WY-NM region has had poorer seismic instrument coverage than any other earthquake-prone region in the western United States (for example, prior to 2000 there were two or fewer permanent seismographs in the entire state of Colorado).
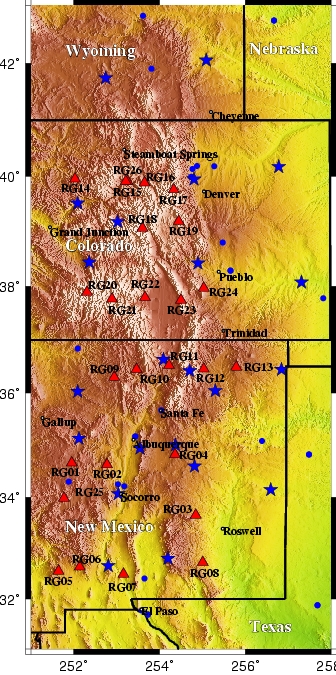
    In the map at left, seismicity in the Intermountain Seismic Belt (the dense cloud of earthquakes in Utah and stretching along the Idaho-Wyoming border to Yellowstone) is well-measured down to about magnitude 2 or 2.5, because of a dense (<50 km-spaced) network of seismographs maintained by the University of Utah. By comparison, the catalog in the RGR is well-measured only down to about magnitude 3.5 or 4.

    Analysis of the historical seismic record is further complicated by dramatic increases in seismic activity associated with deep wastewater injection wells in recent years: The 1966 M5 and associated earthquakes near Denver, CO in the map at left are well-established to have resulted from deep nuclear wastewater disposal at Rocky Mountain Arsenal, and activity including the 2005 & 2011 M5+ earthquakes near Trinidad (in the CO-NM border region) relates to energy industry wastewater injection there. Consequently, spatial concentrations of background seismicity and other important information such as magnitude-frequency relations are very poorly known in this region.


    PAST (PREHISTORICAL) EARTHQUAKES


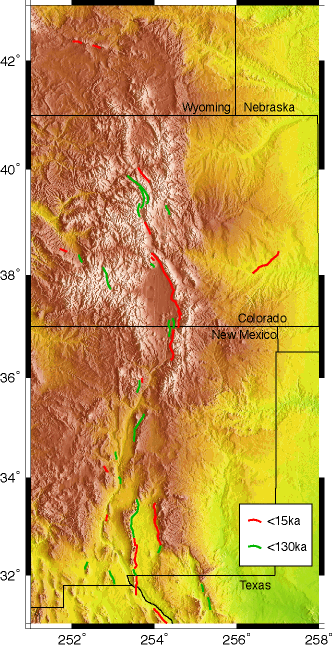
    Surface Fault Ruptures from the USGS Quaternary Fault and Fold Database, 130ka to present.

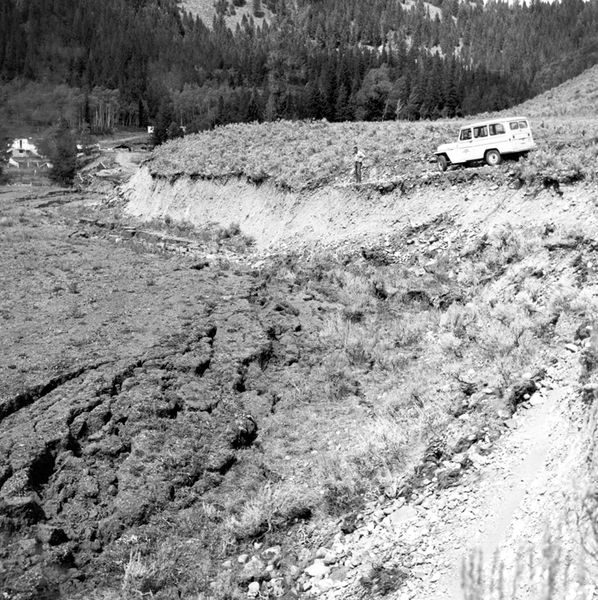
    Scarp produced by the 1959 (M 7.5) Hebgen Lake earthquake (image courtesy USGS).

    The study of prehistorical earthquakes (or "paleoseismology") is based on geologic mapping of fault structures and recognizable surface scarps. The best data come from scarps that have been trenched (i.e., a trench dug crossing the scarp), which allows geologists to examine the offset soil horizons and date the offsets. Most of what we do know about earthquake hazard in the RGR comes from paleoseismology.

    For an earthquake to rupture cleanly all the way to the Earth's surface, it must be relatively large (a minimum magnitude ~6.5 and more often nearer 7.0). The figure at left shows fault scarps that moved in the last 130,000 years in green, and scarps that moved in the past 15,000 years are shown in red. Some of these faults (for example, the Sangre de Cristo fault near Great Sand Dunes National Park in southern Colorado) have moved more than once in the past 15,000 years in events that likely had magnitudes 7.0 to 7.5.

    The faults shown in the figure are by no means the only ones that pose a threat of future large earthquakes. The data depicted here are incomplete: Some faults have been trenched but have not yet found their way into the database, and there are other fault scarps which geologists have not yet gotten time or funds to trench. Moreover, recognizing young, small-offset scarps in the geomorphology of forested regions can be extremely challenging.


    DEFORMATION OF THE GROUND SURFACE


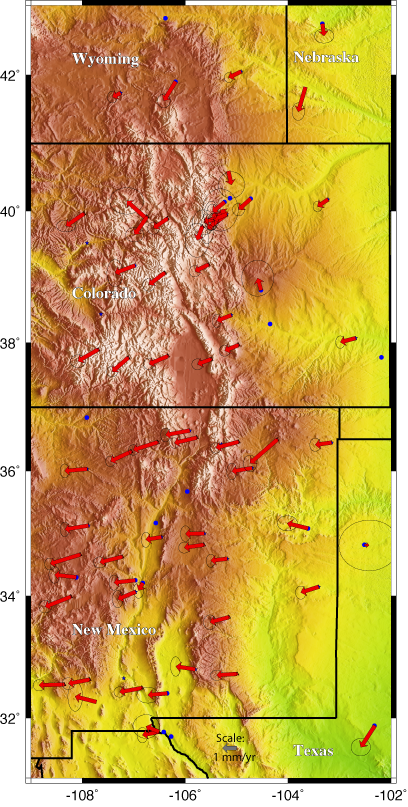
    GPS Surface Velocities using NGS Continuously Operating Reference System (CORS) data.

    Surface deformation is derived from geodetic data, most commonly continuous measurements of GPS position. The figure at left shows the best data currently available for the Rio Grande Rift region, from instruments installed for EarthScope's Plate Boundary Observatory and for the Rio Grande Rift project. Some of these GPS sites show motions in odd directions that likely are not related to tectonics, but ignoring the anomalous motions, the data suggest about 1.5 to 2.5 mm/year of east-west extension across a very (~300 mile) wide region, encompassing the Rio Grande Rift and neighboring Colorado Plateau and Great Plains provinces. The deformation averages about 1.2 nanostrains (or one part in a billion!) per year, and one can use this information to estimate the approximate earthquake hazard by comparison with rates of motion in other regions where earthquakes are more frequent. By comparison, the Intermountain seismic belt (at the western edge of the seismicity map above) averages about 10.2 nanostrains per year. That suggests we should expect (roughly) one earthquake within the Rio Grande Rift for every 2-3 earthquakes of comparable magnitude in Utah and the ID-WY border region (a similar-sized area). But since the extensional zone is much broader than the rift itself, we can expect earthquakes to occur in the Front Range, Great Plains and Colorado Plateau regions as well.

    There are a few problems with estimating earthquake hazard in this way however. For one, the tectonic signals here are so small that other deformation sources start to become significant. For example, seasonal changes in position related to the weight of snow and water depressing the Earth's surface can be several mm in the horizontal and several cm in the vertical! For another, the Rio Grande Rift has been volcanically active in the past, and some of the signals we can see in these data have the fingerprint of slow filling and draining of magma pockets deep in the crust. Since magmatic processes are inherently transient, we can't be certain just how much of the movement is truly tectonic. However, the longer these sites are in operation, the easier it will become to separate out different types of deformation processes.


    In part to overcome these problems, we have installed a network of 25 tectonic-quality GPS sites throughout the Rio Grande Rift region of Colorado and New Mexico. These sites were chosen to complement the existing GPS instrumentation and to densify in the region of the Rio Grande Rift where we expect maximum deformation. In several year's time, we should have a much better idea of the earthquake hazard posed by this tectonic feature!


    At Left: Network of GPS Sites we have installed for this project are shown as red triangles. Blue stars are sites that have been installed for the EarthScope-Plate Boundary Observatory. Blue circles are CORS sites.

    Back to the Rio Grande Rift-Colorado homepage