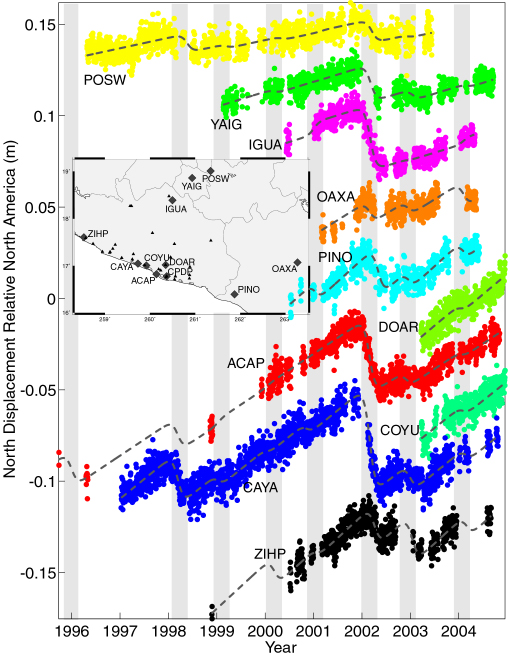
Figure 1. Time series of GPS location in Guerrero, southern Mexico, show 1 to 10 cm reversals
of steady-state motion at intervals of 12.0±0.3 months. These events
indicate slow aseismic thrust slip occurring on the boundary between the Cocos
and North American Plates.
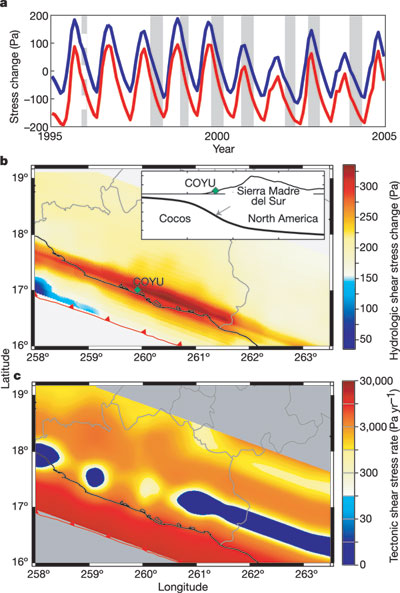
Figure 2. Stress
variations on the plate boundary interface in southern Mexico. (a).
Time series of normal stress (blue; positive indicates fault compression) and
shear stress (red; positive favors thrust slip) caused by hydrologic loading at the
surface, calculated at a point beneath GPS site COYU. Grey bars denote periods of
deep slow slip shown in Figure 1; peak slip occurs at the
center of the bar. (b). Map view of peak-to-peak shear stress perturbation caused by
hydrologic loading,
projected from the plate interface to the surface. Inset shows plate geometry
and strike-averaged topography versus distance from the trench; arrow
indicates location of time series sampled in Figure 2a. (c). Rate of accumulation of
tectonic shear stress caused by motion of the subducting Cocos plate relative to
North America.
|
GPS measurements in various different tectonic environments have recorded
fault movements similar to earthquakes but much slower, occurring over
timescales of ~1 week to ~1 year (see for example the GPS time series in Figure 1).
These "slow slip events" have been observed
for example in Japan, Cascadia, Mexico, Alaska, Hawaii and New Zealand.
The phenomenon is poorly understood, but several observations hint at the
processes underlying slow slip. Modelling of GPS data and estimates of
associated tremor location indicate that slip focuses near the transition from
unstable ("stick-slip") to stable friction at the deep limit of the
seismogenic zone. Perhaps most intriguingly, slow slip is quasi-periodic at
several locations, with recurrence varying from 6 to 25 months depending on
which fault (or even fault segment) is examined.
Lowry
[2006] demonstrates how periodic slow fault slip may
be a resonant response to climate-driven stress perturbations. Fault slip in
southern Mexico recurs annually, and as shown in Figure 2a, stress
perturbations on the fault surface include an annual signal caused by changes
in the weight of water and groundwater at the surface.
The annual stress variation is only of order a few hundred Pa (Figure 2b),
which is a small fraction of the annual tectonic stress accumulation (Figure 2c), so
this stress would not be expected to produce a robust slip response unless the
fault's response to stress was somehow amplified at that period.
Physical relations for rate- and state-dependent friction actually predict an amplified
or "resonant" response at periods of order months to years, depending on
frictional properties (Figure 3). Fault slip resonance helps to explain why slip events
are periodic, why periods differ from place to place and why slip focuses near
the base of the seismogenic zone. It also explains why the time of peak slip differs
from the time of peak stress by about three months in southern Mexico (Figure 2a),
because a ±&pi/2 (=± 3 month) phase shift is predicted for resonant slip
(Figure 3c). (Incidentally, it also helps to explain why event recurrence is not
perfectly regular but instead somewhat variable: The phase relation has extremely steep
slope near the critical period). Resonant slip should initiate slightly within the
rupture zone of future great earthquakes, suggesting that slow slip may
illuminate fault properties that control earthquake slip.
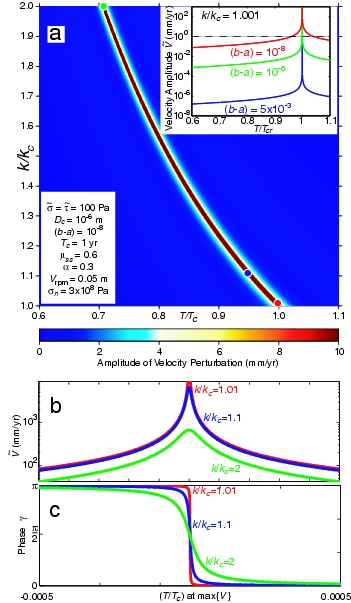 How slow slip resonance depends on rate-state-friction parameters.
(a). Amplitude of slip velocity response to stress at period T
for fault stiffness k (normalized to a critical values Tc=1
year and kc), for parameters
shown in lower-left inset. Upper-right inset, velocity is amplified
when (b−a) is small (i.e. at the frictional transition from
stick-slip to stable sliding). Colored circles are detailed in b and c.
(b). Slip amplitude near its maximum depends on k and T. (c). Phase of slip
(relative to the peak stress) also depends on k and T.
How slow slip resonance depends on rate-state-friction parameters.
(a). Amplitude of slip velocity response to stress at period T
for fault stiffness k (normalized to a critical values Tc=1
year and kc), for parameters
shown in lower-left inset. Upper-right inset, velocity is amplified
when (b−a) is small (i.e. at the frictional transition from
stick-slip to stable sliding). Colored circles are detailed in b and c.
(b). Slip amplitude near its maximum depends on k and T. (c). Phase of slip
(relative to the peak stress) also depends on k and T.
|